- LIVE HELP IS

How Do I Perform Power and Sample Size Calculations for a One Proportion Test?
To determine Power & Sample Size for a 1 Proportion Test, you can use the Power & Sample Size Calculator or Power & Sample Size with Worksheet.
- Click SigmaXL > Statistical Tools > Power & Sample Size Calculators > 1 Proportion Test Calculator.
- Select Solve For Power (1 – Beta). Enter
Sample Size and Alternative Proportion as shown:
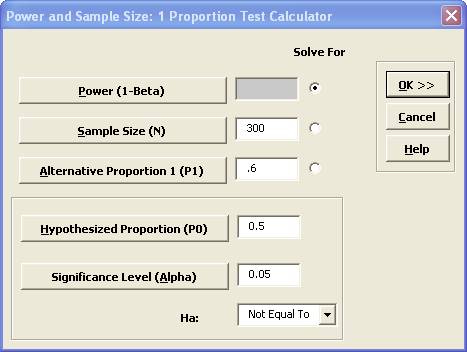
Note that we are calculating the power or likelihood of detection given that the maximum difference between group means = 1, with sample size for each group = 30, 3 groups, standard deviation = 1, significance level = .05, and Ha: Not Equal To (two sided test). - Click OK. The resulting report is displayed:
- To determine Power & Sample Size using a Worksheet, click SigmaXL > Statistical Tools > Power & Sample Size with Worksheet > 1 Proportion Test.
- A graph showing the relationship between Power, Sample Size and Proportion Value can then be created using SigmaXL > Statistical Tools > Power & Sample Size Chart. See here for an example using the 1 Sample t-Test.
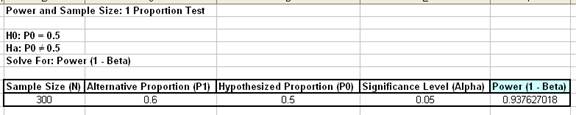
A power value of 0.94 is acceptable, but note that the sample size n = 300, and the difference in proportion value is 0.1 or 10%! The sample size requirements for discrete data are much higher than those for continuous data.
Define, Measure, Analyze, Improve, Control


Simulate, Optimize,
Realize

Web Demos
Our CTO and Co-Founder, John Noguera, regularly hosts free Web Demos featuring SigmaXL and DiscoverSim
Click here to view some now!
Contact Us
Phone: 1.888.SigmaXL (744.6295)
Support: Support@SigmaXL.com
Sales: Sales@SigmaXL.com
Information: Information@SigmaXL.com


