- LIVE HELP IS

How Do I Perform Nonparametric Multiple Comparison Tests in Excel Using SigmaXL?
Kruskal-Wallis Test
The Kruskal-Wallis test is an extension of the Mann-Whitney Rank test, allowing for more than 2 samples. It is a nonparametric equivalent to the parametric One-Way ANOVA. The Null Hypothesis is: H0: Median1 = Median2 = … = MedianK. Ha: At least two Medians are different.- Open Customer Data.xlsx, click on Sheet 1 tab (or press
F4 to activate last worksheet).
- Click SigmaXL > Statistical Tools > Nonparametric Tests > Kruskal-Wallis Median Test. Ensure that the entire data table is selected. If not, check
Use Entire Data Table.
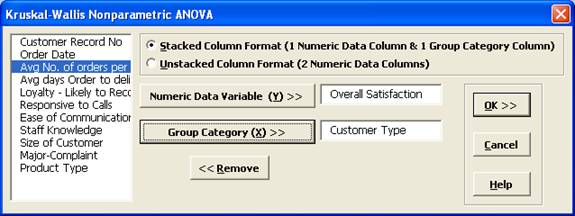
- Click Next. Ensure that Stacked Column Format is checked. Select Overall Satisfaction, click Numeric Data Variable (Y) >>; select Customer Type, click Group Category (X) >>.
- Click OK. The results are shown below:
- The Kruskal-Wallis Statistic is based on comparing mean ranks for each group versus the mean rank for all observations. The Z value for Customer Type 3 is -1.56, the smallest absolute Z-value. This size indicates that the mean rank for Type 3 differed least from the mean rank for all observations. The Z value for Customer Type 2 is 4.53, the largest absolute Z-value. This size indicates that the mean rank differed most from the mean rank for all observations.
- A graphical view of the Overall Satisfaction Median and 95% Confidence Intervals are given to complement the Z scores. The fact that the CI’s for Customer Type 2 do not overlap those of Type 1 or 3, clearly shows that Customer Type 2 has a significantly higher median satisfaction score. The overlap of CI’s for Type 1 and 3 shows that the median satisfaction scores for 1 and 3 are not significantly different.
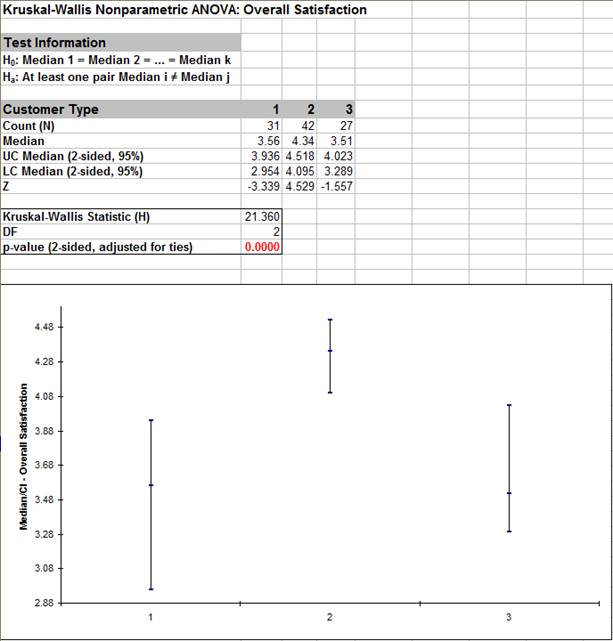
The p-value of 0.0000 tells us that we reject H0. At least one pairwise set of medians are not equal.
Mood’s Median Test
Mood’s Median Test is an extension of the One Sample Sign Test, using Chi-Square as the test statistic. Like the Kruskal-Wallis test, Mood's median test can be used to test the equality of medians from multiple samples. It provides a nonparametric alternative to the one-way analysis of variance. The Null Hypothesis is: H0: Median1 = Median2 = … = MedianK. Ha: At least two Medians are different.Mood's median test is more robust to outliers than the Kruskal-Wallis test, but is less powerful in the absence of outliers. You should first look at your data with Boxplots. If there are extreme outliers, then Mood’s Median should be used rather than Kruskal-Wallis.
- Open Customer Data.xlsx, click on Sheet 1 tab (or press F4 to activate last worksheet).
- Click SigmaXL > Statistical Tools > Nonparametric Tests > Mood’s Median Test. Ensure that the entire data table is selected. If not, check Use Entire Data Table.
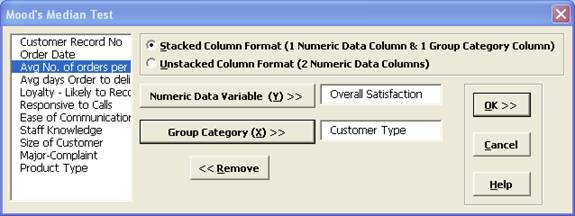
- Click Next. Ensure that Stacked Column Format is checked. Select Overall Satisfaction, click Numeric Data Variable (Y) >>; select Customer Type, click Group Category (X) >>.
- Click OK. The results are shown below:
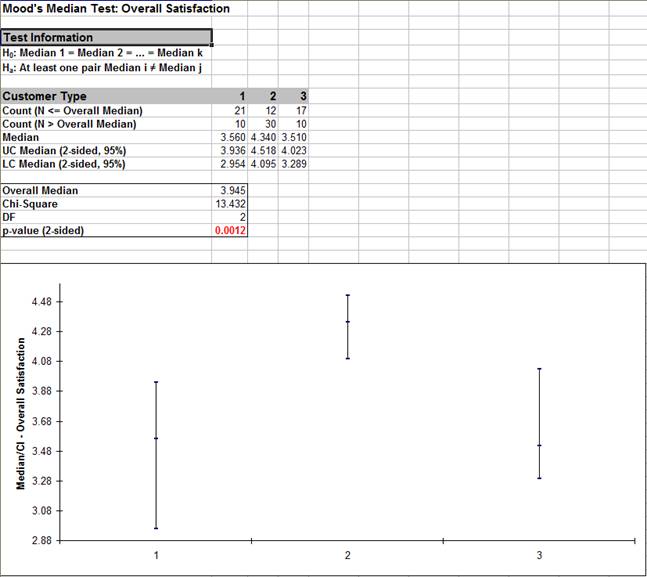
The p-value of 0.0012 tells us that we reject H0. At least one pairwise set of medians are not equal. - A graphical view of the Overall Satisfaction Median and 95% Confidence Intervals are given. This is the same graph provided in the Kruskal-Wallis test report.
Define, Measure, Analyze, Improve, Control


Simulate, Optimize,
Realize

Web Demos
Our CTO and Co-Founder, John Noguera, regularly hosts free Web Demos featuring SigmaXL and DiscoverSim
Click here to view some now!
Contact Us
Phone: 1.888.SigmaXL (744.6295)
Support: Support@SigmaXL.com
Sales: Sales@SigmaXL.com
Information: Information@SigmaXL.com


