This is the same Robust Cake Experiment adapted from the Video Designing Industrial Experiments, by Box, Bisgaard and Fung, analyzed earlier using a Three Factor Full-Factorial. Here we will use the Taguchi L8 Three Factor.
- Click SigmaXL > Help > Template Examples > Taguchi Examples > L8 Three Factor - Robust Cake to open the example file. If you wish to start with a blank template and populate the values, click SigmaXL > Design of Experiments > Basic Taguchi DOE Templates > Taguchi L8 (2 Level) > Three Factor (with Two-Way Interactions).
- The response is Taste Score (on a scale of 1-7 where 1 is "awful" and 7 is "delicious").
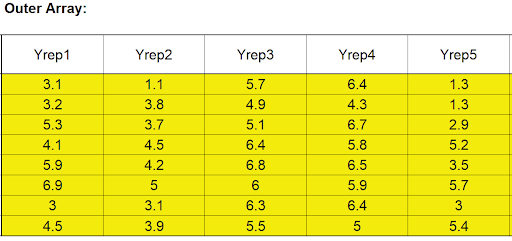
- The five Outer Array values (Yrep1 to Yrep5) have different Cooking Time and Temperature Conditions.
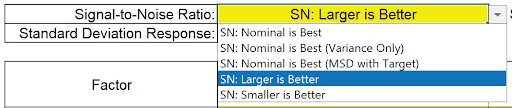
- The goal is to maximize the Taste Score (with minimum variation), so we will maximize the Signal-to-Noise Ratio SN:Larger is Better, selected from the list as shown:
- The Inner Array controllable factors are Flour, Butter and Egg. Actual low and high settings are not given in the video, so we will use coded 1 and 2 values for Level 1 and Level 2. Note that the Taguchi L8 standard sort order (left to right) is different from Full-Factorial (right to left), so we will enter Factor Name as Egg, Butter, Flour to adjust for this difference. (In the Full- Factorial it was Flour, Butter, Egg).
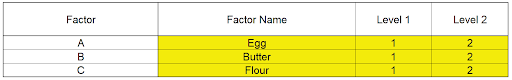
- We are looking for a combination of Egg, Butter, and Flour that will not only taste good, but consistently taste good over a wide range of Cooking Time and Temperature conditions.
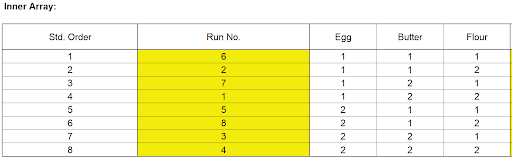
- The runs were randomized and order recorded in the column Run No. The Outer Array Taste Score values are entered as shown:
Scroll to the right to view the calculated statistics:
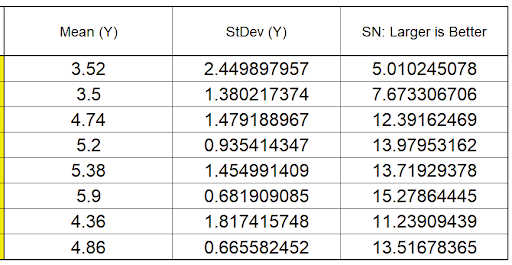
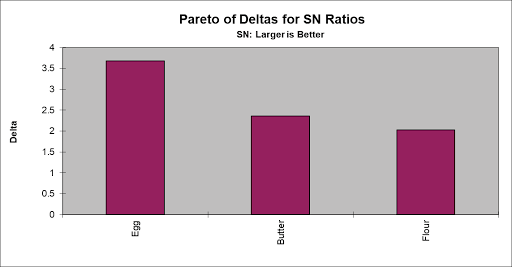
- We will focus our analysis on the Signal-To-Noise Ratio and review the Mean and StDev afterward as a check on the results. Scroll right and down to view the Pareto of Deltas for SN Ratios:
- Scroll down to look at the Main Effects Plot for SN Ratios:
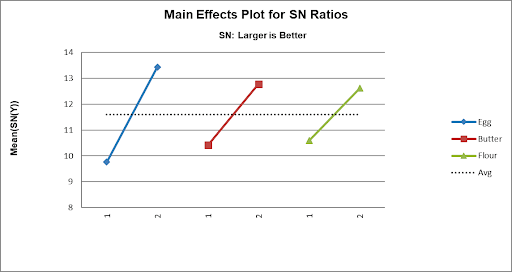
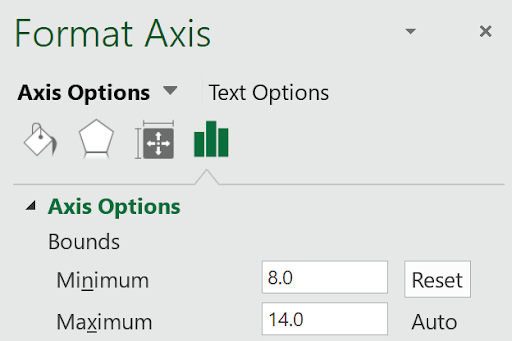
It initially appears that the maximum Taste Score occurs with Egg = 2, Butter = 2 and Flour = 2. Note: The Y Axis has been adjusted to get a better scale (double click on the Y-Axis to open Excel Format Axis dialog, click Axis Options and set Minimum = 8 as shown).
- However, this design permits the analysis of interactions, so we will now look at the Pareto of ANOVA SS (Sum-of-Squares) % Contribution for SN Ratios which includes Main Effects and Interactions:
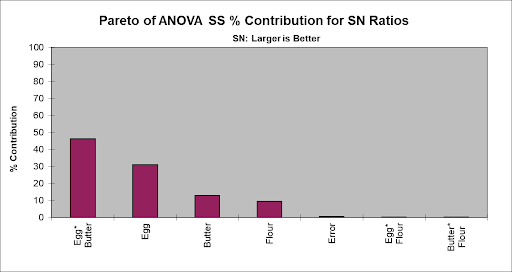
- Now we see that the Egg*Butter interaction is clearly the dominant factor (in agreement with the analysis done earlier using the Three Factor Full-Factorial).
Note 1: The "Error" term in this model is the three-way interaction which is assumed to be negligible, so is not included in the model.
Note 2: SigmaXL does not compute a significance line in the Taguchi Templates, as done in the Three Factor Full-Factorial Template. Taguchi recommends pooling of effects to estimate experimental error which will be demonstrated later.
- Scroll down to view the Interaction Plot for SN Ratios for the Egg*Butter Interaction:
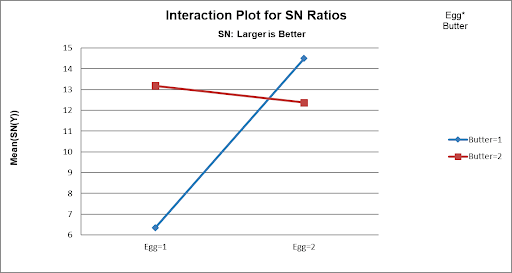
Now we can clearly see the large effect due to the two-way interaction. The effect that Egg has on Taste depends on what the Butter setting is. The maximum SN Ratio for Taste Score is achieved with Egg = 2 and Butter = 1.
Note 1: The Y Axis has been adjusted to improve visibility (Minimum = 6).
Note 2: The Interaction Plot X-axis/Legend factors may be switched by clicking on the chart, then selecting Excel Design > Switch Row/Column as shown:

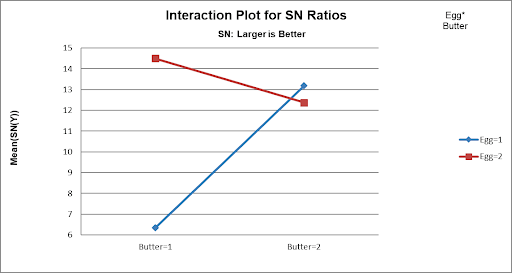
- From the above plots, we conclude that the optimum setting to produce a maximum Taste Score SN Ratio is: Egg = 2, Butter = 1 and Flour = 2. (If we had only considered the Main Effects plot, we would have incorrectly set Butter = 2).
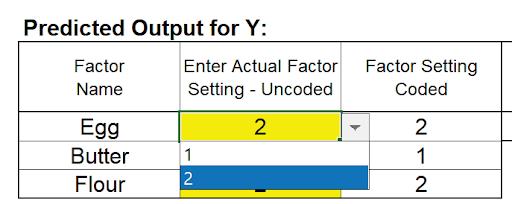
- Scroll up and left to enter these values in the Predicted Output Calculator. Factor settings can be manually entered or selected from the drop-down list as shown:
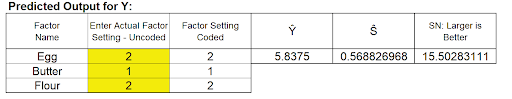
This gives the predicted Mean, Standard Deviation and SN Ratio for Taste Score and agrees with the results obtained in Part B, the analysis of the Three-Factor Full Factorial. (The predicted values are slightly different because the Full Factorial includes the three-way interaction term in the model, whereas this is considered as an error term in the Taguchi Template).
Note: This calculator treats the factors as categorical, so levels can be numeric or text. The drop-down list is a convenient way to select the factor levels, but unfortunately Excel Solver cannot be used with this calculator to perform optimization. We will demonstrate the use of Solver with Multiple Regression later.
- As a validation of the SN Ratio analysis, we will review the Plots for Mean and Standard Deviation:
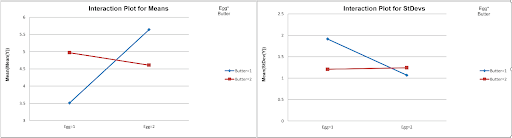
From the Pareto of ANOVA SS % Contribution for Means, we see that the Egg*Butter interaction is the dominant contributor to Mean Taste Score. Looking at the Egg*Butter Interaction Plot for Means, the optimum setting to maximize Mean Taste Score is Egg = 2 and Butter = 1. (Note: The Y Axis has been adjusted).
Looking at the Pareto of ANOVA SS % Contribution for StDevs, Flour is the dominant factor for Standard Deviation. The Main Effects Plot for StDevs shows that the optimum setting to minimize the StDev Taste Score is Flour = 2.
This is in agreement with the settings determined from the SN Ratio. Taguchi advocates the use of SN Ratio as it is simpler, looking at only one variable, but some practitioners prefer to analyze the Mean and Standard Deviation separately.
Multiple Regression and Excel Solver (Advanced Topics):
- The Taguchi L8 Orthogonal Array (or L8 Dummy Coding) may be analyzed using Multiple Regression Analysis, adding and removing terms from the model as necessary. Terms that are removed will be used to estimate error for p-values. As noted earlier, SigmaXL does not compute a significance line in the Taguchi Template Pareto Charts. Taguchi recommends pooling of effects to estimate experimental error and this will be demonstrated here. Also, Solver cannot be used with the Predicted Output calculator in the Taguchi Template, but will be used in the Multiple Regression report.
- We will be analyzing the SN: Larger is Better Ratio as the response in this example. The analysis may be repeated separately for the Mean and StDev.
- From the Pareto of ANOVA SS % Contribution for SN Ratios, we see that the Error term (threeway interaction), Egg*Flour and Butter*Flour interactions are negligible compared to the other factors (each less than 1% contribution). As an initial attempt at pooling we will remove these terms from the regression model.

- Highlight the L8 Orthogonal Array cells (AL18:AV26) as shown.
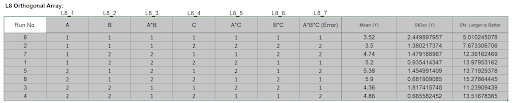
The Orthogonal Array displays the factor letters, not the names, so recall that A is Egg, B is Butter and C is Flour.
- Click SigmaXL > Statistical Tools > Regression > Multiple Regression. Click Next.
- Select SN: Larger is Better, click Numeric Response (Y) >>; holding the CTRL key, select A, B, A*B, and C, click Continuous Predictors (X) >> as shown:
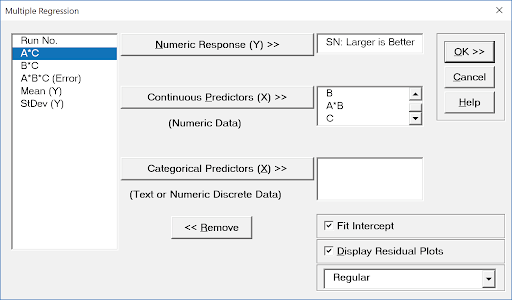
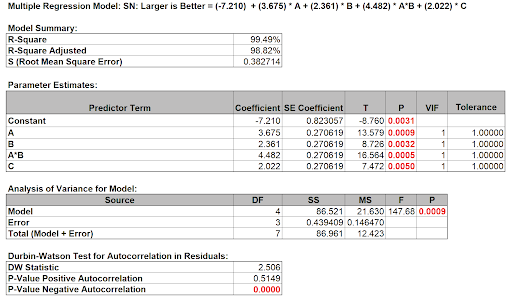
- Click OK. The resulting regression report is shown:
- Now we will use the Predicted Response Calculator to determine the factor settings that maximize the SN Ratio:
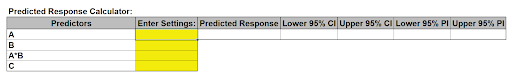
- All entries must be in coded units of 1 to 2 as given in the Orthogonal Array. While the calculator in the Taguchi Template uses strictly categorical factors, here we can use either categorical or continuous.
- Since the Taguchi Orthogonal Array is coded 1, 2 rather than -1, +1, we cannot simply multiply Factor A * Factor B to compute the A*B interaction.
- Turn on the Excel Row and Column headers in the Multiple Regression sheet: File > Options > Advanced. Scroll down to Display options for the worksheet. Check Show row and column headers. Click OK.
- In cell A*B (K14), enter the formula:
=1.5 - 2*(K12-1.5)*(K13-1.5)
This formula centers and scales the A (K12) and B (K13) values so that the A*B (K14) value will match the values in the Taguchi array. Enter A = 1, B = 1, C =1 (be careful to not overwrite the formula - you may wish to change the K14 cell color as shown). The A*B value is 1.
- Optionally, test the formula entry, enter A=1, B=2, confirming that A*B = 2. Repeat for A=2, B=1 resulting in A*B = 2 and A=2, B=2 resulting in A*B = 1. Now reset back to A=1 and B=1.
- Click Excel Data > Solver to open the Solver dialog (if the Solver menu option does not appear, click File > Options > Add-Ins. Adjacent to Manage Excel Add-ins, click Go. Check Solver Add-in. Click OK ). Set the Solver Parameters as shown:
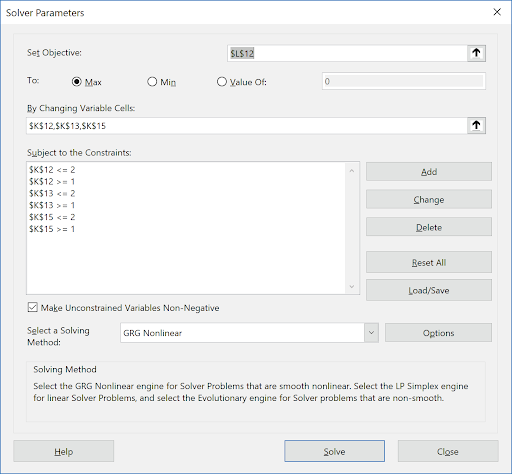
Cell L12 is the predicted response (SN Ratio). Solver will try to maximize this value. Cells K12, K13, and K15 are the A, B, and C Coded Factor Settings to be changed, with the constraints that the values are >=1 and <=2 GRG Nonlinear is used here. (Note that if any of the factors are modeled as categorical, Evolutionary is recommended). Click Solve.
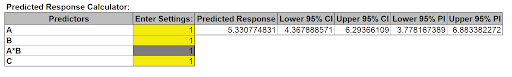
- The Solver solution that maximizes SN Ratio is given in the Predicted Response Calculator as A (Egg) = 2, B (Butter) = 1 and C (Flour) = 2. These are in agreement with our earlier manual analysis. Confidence Intervals for the Mean SN Ratio and Prediction Intervals for Individual SN Ratio values are also reported.
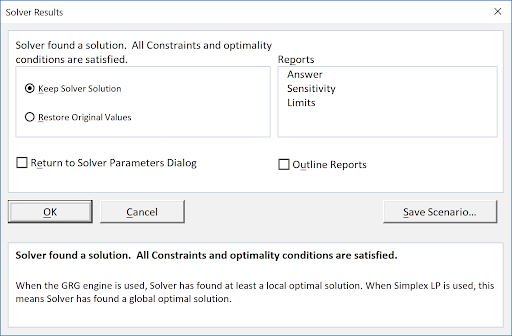
- Click OK to keep the Solver solution.
- This analysis may be repeated using the Mean and Standard Deviation as responses. A note of caution when using the Prediction Interval for the Mean, the individual values are averages across the Outer Array, not true individual value.